
STOCKTON, Calif. — August 18, 2026 — (KOREWIRE) What if the temperature called “normal” in your local weather report isn’t really normal anymore?
Nowmal, a new climate-aware weather platform, has published a national analysis identifying the U.S. counties where current temperature patterns have drifted furthest from established climate normals—and the places where that shift has been smallest or has actually moved in the opposite direction.
The results reveal striking geographic differences.
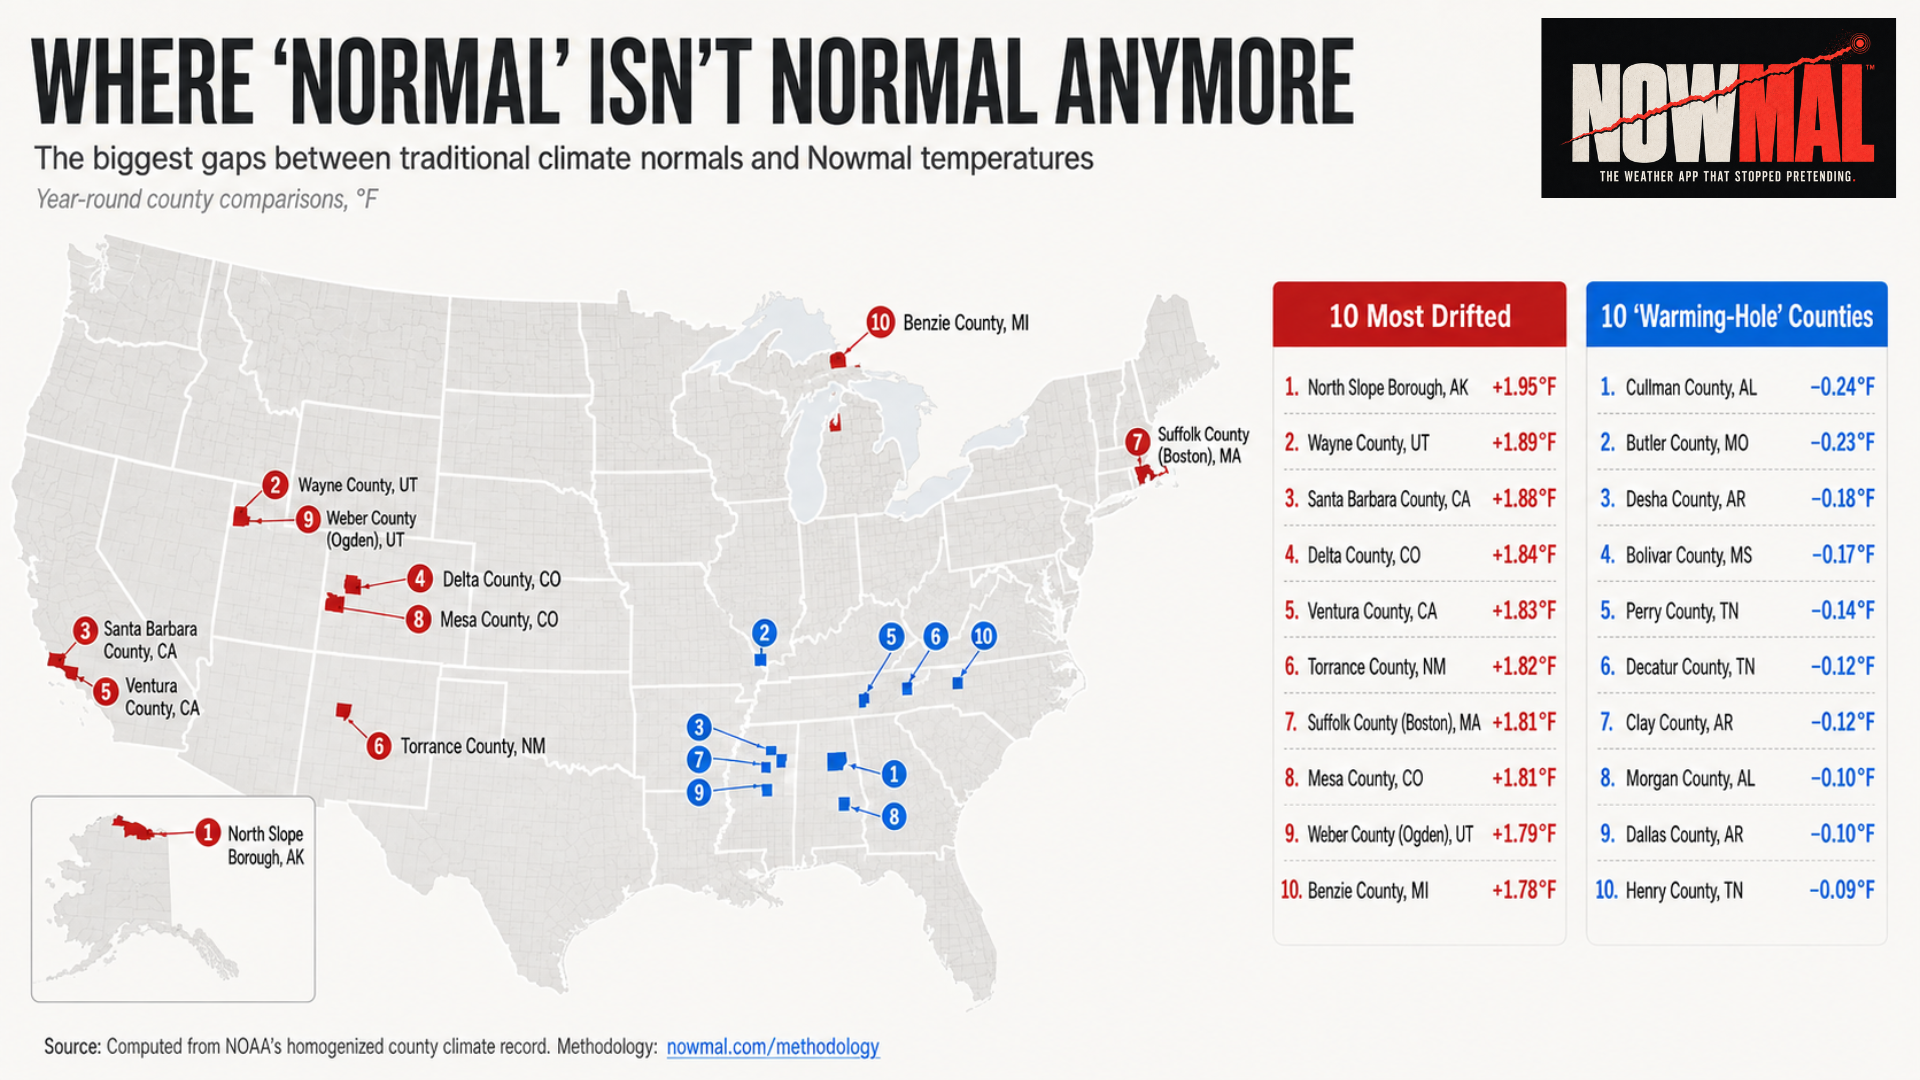
The largest year-round gap appears in North Slope Borough, Alaska, at +1.95°F, followed closely by Wayne County, Utah, at +1.89°F, and Santa Barbara County, California, at +1.88°F.
Among the ten most-drifted places are counties in Alaska, California, Colorado, Massachusetts, Michigan, New Mexico and Utah.
“People hear the word ‘normal’ every day in weather reports, but climate change means yesterday’s normal increasingly fails to describe the world we actually live in,” said Devin Thorpe, founder of Nowmal. “Nowmal is about making that gap visible. We want people to understand not just whether today is hotter or colder than normal, but whether ‘normal’ itself still deserves to be our reference point.”
The 10 U.S. Places Where “Normal” Has Drifted Most
Based on year-round temperature differences calculated from NOAA’s homogenized county climate record:
-
North Slope Borough, Alaska — +1.95°F
-
Wayne County, Utah — +1.89°F
-
Santa Barbara County, California — +1.88°F
-
Delta County, Colorado — +1.84°F
-
Ventura County, California — +1.83°F
-
Torrance County, New Mexico — +1.82°F
-
Suffolk County, Massachusetts (Boston) — +1.81°F
-
Mesa County, Colorado — +1.81°F
-
Weber County, Utah (Ogden) — +1.79°F
-
Benzie County, Michigan — +1.78°F
The geographic diversity is notable. The list stretches from Arctic Alaska to coastal Southern California and includes metropolitan Boston, the Mountain West and northern Michigan.
Utah alone places two counties in the top 10.
“This isn’t a story about one unusually hot city or one record-breaking summer,” Thorpe said. “These rankings look through the daily weather noise to ask a more fundamental question: How far has the climate beneath our familiar definition of ‘normal’ already moved?”
Not Everywhere Is Warming the Same Way
Nowmal is also publishing the other side of the data.
Across the nationwide county analysis, 36 counties show a negative gap, meaning the historical “normal” actually runs warmer than the more recent Nowmal measure. Rather than hide those exceptions, Nowmal is highlighting them.
The ten largest negative gaps are:
-
Cullman County, Alabama — −0.24°F
-
Butler County, Missouri — −0.23°F
-
Desha County, Arkansas — −0.18°F
-
Bolivar County, Mississippi — −0.17°F
-
Perry County, Tennessee — −0.14°F
-
Decatur County, Tennessee — −0.12°F
-
Clay County, Arkansas — −0.12°F
-
Morgan County, Alabama — −0.10°F
-
Dallas County, Arkansas — −0.10°F
-
Henry County, Tennessee — −0.09°F
The clustering across parts of the South reflects the complexity of regional climate change and underscores why Nowmal is publishing both ends of the rankings.
“If we only published the places that support the simplest possible warming narrative, we wouldn’t be doing this honestly,” Thorpe said. “A yardstick you can trust in Boston has to be equally honest in Alabama. Climate change is real, but it isn’t geographically uniform. The exceptions make the data more interesting—and the story more credible.”
From “Normal” to Nowmal
Nowmal is being developed around a simple premise: weather should be reported in the context of the climate people actually live in now.
Traditional climate normals remain useful and important benchmarks. But as climate conditions change, comparing every hot or cold day exclusively with a historical baseline can obscure how much the baseline itself has shifted.
Nowmal calls that emerging reference point “Nowmal.”
The rankings are intended to make those changes tangible at the local level. Readers can explore both the places experiencing the greatest drift and those where the historic benchmark remains closest to—or slightly warmer than—current conditions.
The complete rankings include:
-
The 100 places where normal has drifted most: nowmal.com/rankings/most-drifted
-
The 100 places where normal has drifted least: nowmal.com/rankings/least-drifted
The least-drifted ranking includes all 36 counties with negative gaps and the 64 counties with the smallest positive gaps.
Nowmal’s methodology is published at nowmal.com/methodology. The rankings are computed from NOAA’s homogenized county climate record.
“This is ultimately about making climate change personal and understandable,” Thorpe said. “A global temperature anomaly can feel abstract. Seeing what has happened to the meaning of ‘normal’ where you live is different. That’s the conversation Nowmal exists to provoke.”
About Nowmal
Nowmal is a climate-aware weather initiative built around a simple question: What if “normal” isn’t normal anymore? Nowmal uses climate data to put everyday weather into the context of a changing climate, helping people see how the conditions they experience today compare with both traditional climate normals and the climate taking shape around them. Nowmal was created by The Super Crowd, Inc., a public benefit corporation.
Learn more at nowmal.com.
Media Contact
Devin Thorpe
CEO, TSCI
801-930-0588
nowmal.com